Ever wondered why your app feels sluggish even though you've offloaded all the heavy lifting to a Web Worker? We've all been there: you move a complex data transformation off the main thread, pat yourself on the back, and yet the UI still stutters. Until recently, diagnosing exactly why that worker was causing jank was a bit of a dark art.
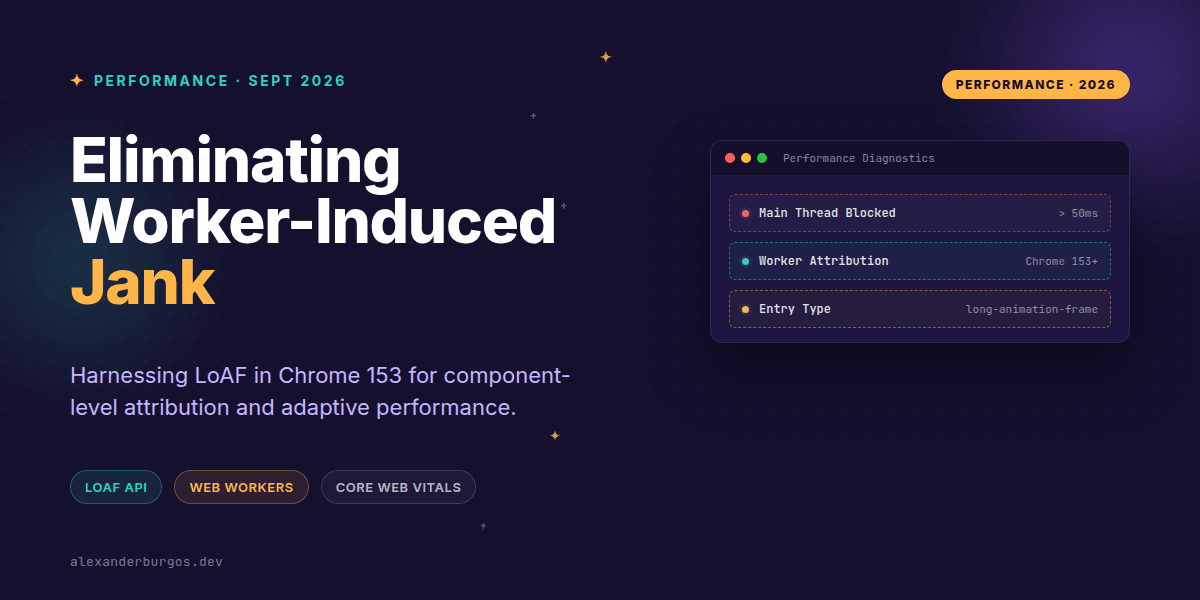
The Long Animation Frames (LoAF) API has been a game-changer since it shipped in Chrome 123, but Chrome 153 takes it to the next level by extending support to dedicated workers. This means we can finally stop guessing and start attributing rendering delays to the specific background scripts causing them.
What Exactly is a Long Animation Frame?
In the world of web performance, a 'Long Animation Frame' is defined as any rendering update that takes longer than 50ms. While the standard 60Hz refresh rate gives us about 16.7ms per frame, the 50ms threshold is the point where users start to perceive a lack of responsiveness.
Unlike the older Long Tasks API, LoAF gives us a much fuller picture. It doesn't just look at a single script execution; it looks at the entire rendering update, including style calculations, layout, and the work done across multiple tasks that eventually delay a frame. With the update in Chrome 153, this 'picture' now includes the work happening in your dedicated workers.
Instrumenting for Real User Monitoring (RUM)
I've found that the best way to use this is through a PerformanceObserver. By capturing these entries in the wild, you can identify which components are causing the most friction for your users. Here's how you might set up a basic RUM listener:
const observer = new PerformanceObserver(list => {
  for (const entry of list.getEntries()) {
    const scripts = entry.scripts?.map(s => ({
      url: s.sourceURL,
      function: s.sourceFunctionName,
      duration: s.duration,
      invoker: s.invoker
    }));

    // Send to your analytics endpoint
    navigator.sendBeacon("/rum/loaf", JSON.stringify({
      duration: entry.duration,
      blocking: entry.blockingDuration,
      scripts
    }));
  }
});

observer.observe({ type: "long-animation-frame", buffered: true });
One pro tip: don't send every single LoAF record. In a complex application, these can be high-volume. I recommend sampling and aggregating the data by component or function name to keep your analytics costs down and your insights clear.
Attributing Work to Components
The real magic happens when you correlate worker messages with component-level labels. Since the browser doesn't know which React or Vue component triggered a worker message, you'll want to add that metadata yourself. When your worker finishes a task, send back the component ID so your RUM system can tie the resulting LoAF to a specific part of your UI.
// worker.js
self.onmessage = ({ data }) => {
  const startTime = performance.now();
  const result = heavyCalculation(data.payload);

  self.postMessage({
    component: data.component,
    duration: performance.now() - startTime,
    result
  });
};
Adaptive UX: Responding to Jank
Okay, I'm genuinely excited about the possibility of adaptive UX. Instead of just logging performance data, we can use it to change the app's behaviour in real-time. If you detect a sequence of frames exceeding 50ms, you could:
- Switch from a complex animation to a simpler fade.
- Batch DOM updates into smaller chunks to give the main thread breathing room.
- Virtualise lists that were previously rendered in full.
- Defer non-essential telemetry or background syncing.
Common Misconceptions
It's easy to assume that moving code to a worker 'solves' performance. It doesn't. It just moves the computation. The overhead of serialising large data structures and the main-thread work required to handle the worker's response still counts. If your worker sends back a massive JSON object that requires a 100ms DOM update, you've still got a LoAF on your hands.
Also, remember that 50ms isn't a hard limit for a 'dropped frame'. If you're aiming for 60fps, you actually only have 16.7ms. The LoAF API is specifically designed to catch the worst offenders—the ones that make the UI feel frozen.
Wrapping Up
- Use the LoAF API to gain visibility into how background workers impact your main-thread rendering.
- Don't just collect data—use it to build adaptive UX patterns that scale with the user's hardware.
- Always feature-detect
long-animation-framesupport, as it's still rolling out across different browsers.
I encourage you to open up the Performance tab in Chrome 153 and see what your workers are actually doing. You might be surprised at what's been hiding in the background.
If you want to go deeper and learn how to build real, production-ready CSS design systems step by step, check out my full course here: CSS Design Systems Course
The full story including the testing layers and governance lives in Ship Your Design System on Amazon.
Feel free to reach out and share your performance wins with me on Twitter or connect with me on LinkedIn.