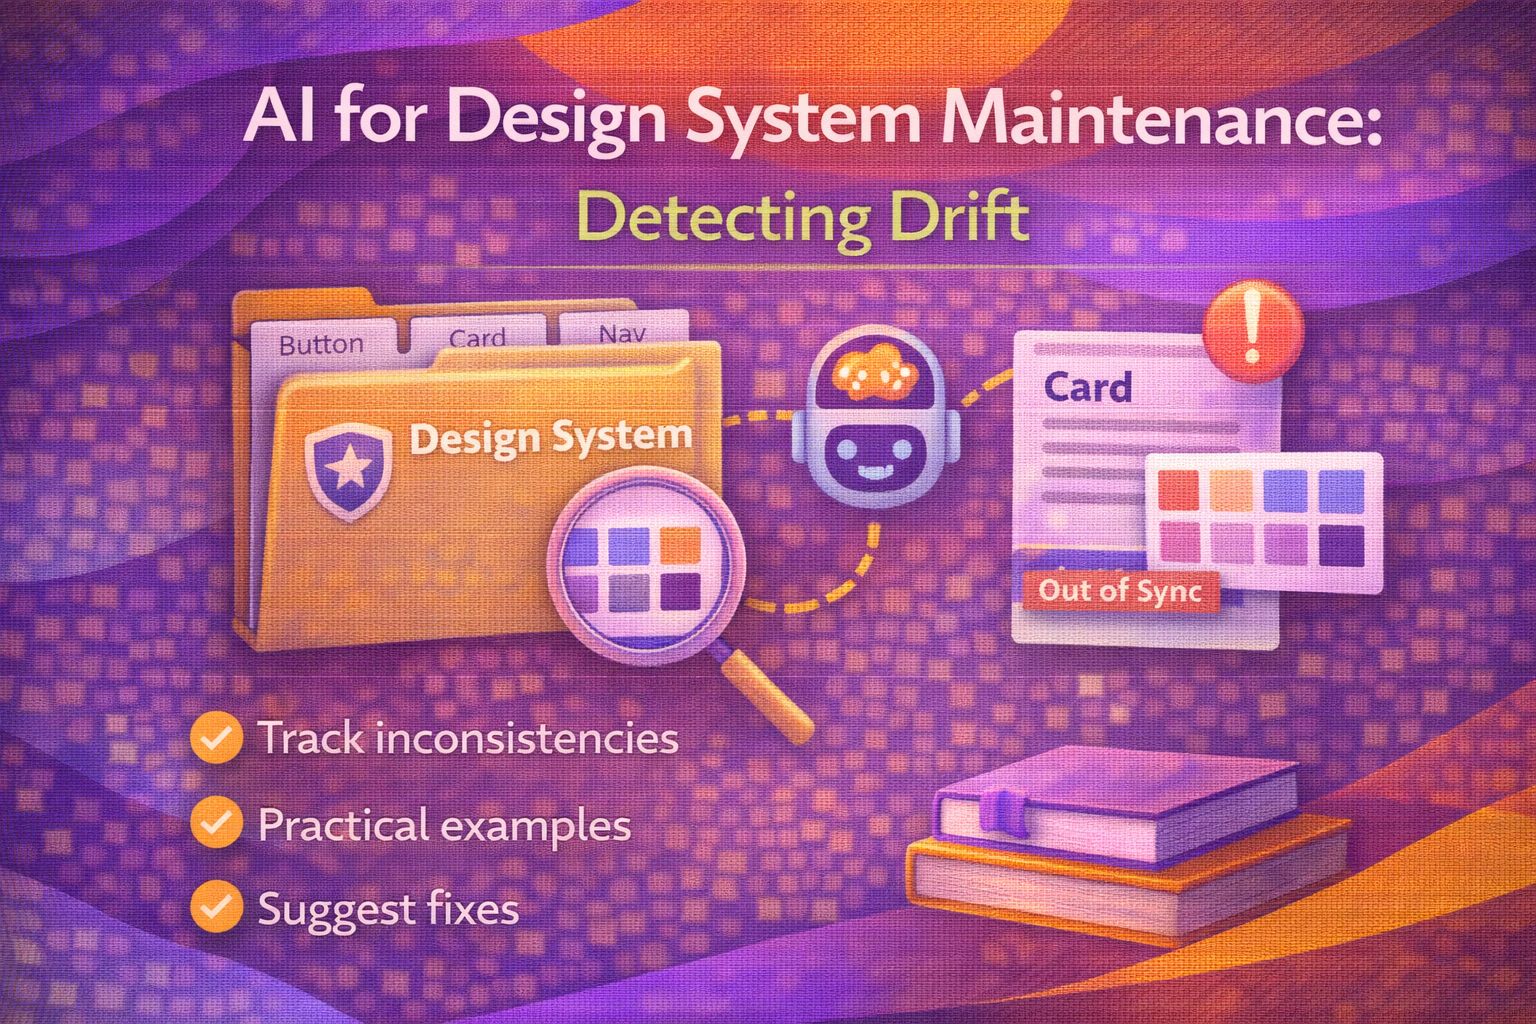
Ever wondered why, despite our best efforts with documentation and tokens, design systems eventually start to feel... messy? You know that feeling when you spot a button that's just three pixels too wide, or a hex code that's slightly 'off' from the brand palette? We call this 'Design Drift', and honestly, it's the silent killer of even the most robust systems.
In my experience, manual audits are a nightmare. They're time-consuming, subjective, and usually out of date by the time the report is finished. But here's the cool bit: we can actually borrow techniques from Machine Learning Operations (MLOps) to automate this. By treating our UI components like data points, we can use AI to flag inconsistencies before they ever reach production.
The Concept: What is Design Drift?
In the world of AI, 'drift' happens when the data a model sees in the real world starts to look different from the data it was trained on. In a design system, it's exactly the same. Your 'reference data' is your Figma library or your core CSS tokens. Your 'current data' is what's actually being shipped in your React components or raw CSS files across various products.
The struggle is real: as teams scale, the gap between these two columns grows. Using AI isn't just about being 'trendy'; it's about having an automated gatekeeper that understands the statistical distribution of your design language.
How AI Detects Inconsistencies
We can approach this in two ways. First, there's Data Drift, where we look at the raw values (like border-radius or padding). Second, there's Anomaly Detection, where we use algorithms to spot 'weird' components that don't fit the family profile. Let's look at the process flow for an automated maintenance pipeline:
Practical Implementation: Detecting Data Drift
To get started, I've found that Python's `evidently` library is a game-changer. While it's built for ML models, we can treat our design tokens as a dataset. Imagine we have a CSV of all the button paddings used across 50 different micro-frontends. We can compare them to our 'Gold Standard' reference.
import evidently
from evidently.report import Report
from evidently.metric_preset import DataDriftPreset
import pandas as pd

# 1. Load your Design System Reference (The 'Truth')
reference_df = pd.read_csv('design_system_tokens.csv')

# 2. Load the actual values found in production
current_df = pd.read_csv('production_audit_results.csv')

# 3. Generate a Drift Report
report = Report(metrics=[DataDriftPreset()])
report.run(reference_data=reference_df, current_data=current_df)

# 4. Save the visual report
report.save_html("design_drift_report.html")
What's happening here? The AI checks the distribution. If it sees that 80% of your buttons now have `13px` padding instead of the required `16px`, it flags a drift. It's not just checking one file; it's looking at the trend across your entire organisation.
Spotting Anomalies with Isolation Forests
Sometimes drift isn't a slow trend; it's a single, glaring mistake. This is where Anomaly Detection comes in. I'm a big fan of the 'Isolation Forest' algorithm. It's brilliant for spotting the 'outliers'—those components that are so far removed from your design system rules that they shouldn't exist.
from sklearn.ensemble import IsolationForest
import numpy as np

# Example: Features could be [font_size, line_height, contrast_ratio]
# We train the model on 'correct' component data
data = np.array([[16, 1.5, 7.1], [14, 1.4, 4.5], [18, 1.6, 12.0]])

# Initialize the model
# 'contamination' is the % of data we expect to be wrong
model = IsolationForest(contamination=0.1)
model.fit(data)

# Test a new component: [size 12, height 1.0, contrast 2.1]
new_component = np.array([[12, 1.0, 2.1]])
prediction = model.predict(new_component)

if prediction[0] == -1:
    print("🚨 Design Inconsistency Detected: This component is an outlier!")
Trust me on this one—setting up a simple script like this to run in your CI/CD pipeline can save you hours of manual visual regression testing. It catches the things that a human might miss during a tired Friday afternoon code review.
Best Practices for AI Maintenance
- Don't be too strict: Set your p-value thresholds conservatively at first. You don't want a slack notification every time someone rounds a corner by 0.5px.
- Monitor Output, not just Input: Don't just check the CSS files; check the rendered output (the predictions). Drift often hits the visual layer before the tokens themselves are changed.
- Continuous Retraining: As your brand evolves, your 'Reference Data' must evolve too. If a design change is intentional, feed it back into the AI as the new 'normal'.
- Human in the Loop: AI flags the drift, but a UX Engineer decides if it's a bug or a 'creative evolution' that needs to be formalised into the system.
Wrapping Up
Maintaining a design system is a marathon, not a sprint. Using AI to detect drift turns a reactive, 'fire-fighting' workflow into a proactive, data-driven strategy. It allows us to focus on building new features rather than policing hex codes.
- Design Drift is the statistical deviation from your core design tokens.
- Tools like Evidently AI can automate the detection of these trends across large codebases.
- Isolation Forests are perfect for spotting one-off UI anomalies that break your system's rules.
I'd really encourage you to try running a basic drift report on your current project. You might be surprised (or slightly horrified) by what you find hidden in those CSS files!
If you want to go deeper and learn how to build real, production-ready CSS design systems step by step, check out my full course here: CSS Design Systems Course
Got questions or want to share how you're using this? Drop me a message on LinkedIn - I always enjoy chatting about this stuff!